Motivation
For a small Kubernetes cluster, I needed a minimal dashboard where logs from all the running applications in the Kubernetes environment can be viewed or grepped from one place.
I thought about ELK (Elastic + Logstash + Kibana) first, but then I realized my small cluster has a config of only 2 nodes with a total 2 vCPU and 4GB RAM, which wouldn’t be a wise option for Elastic to run since it requires more resources to run smoothly. I wanted to use as few resources as possible to have the logging architecture setup.
Let’s see if the FIG ➡ (FluentBit + InfluxDB + Grafana) stack can do for us!
The FIG logging architecture in Kubernetes
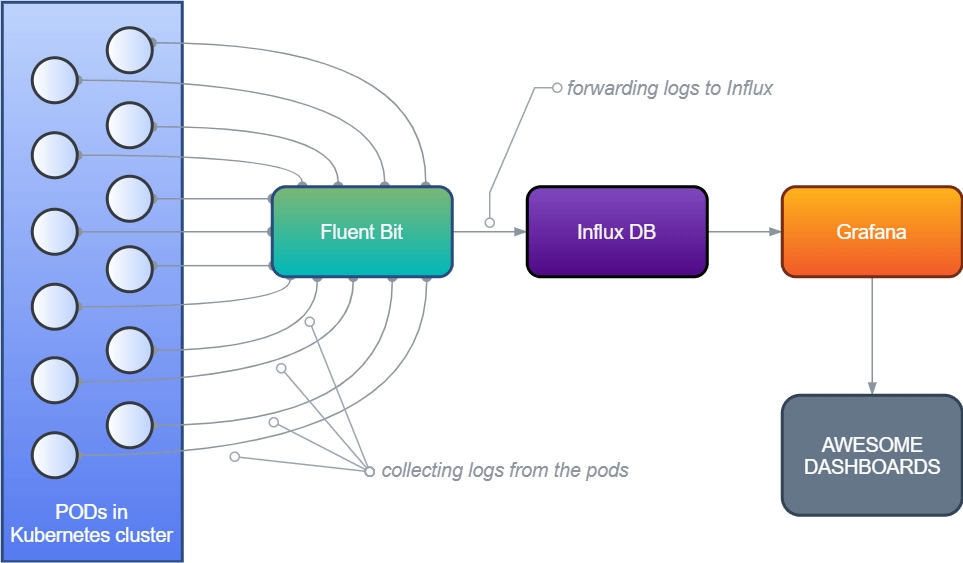
The High-Level Architecture
Fluent Bit used as the log processor which will collect all the stdout from all the pods in Kubernetes and forward them to a data storage. Fluent Bit** **is a part of the Fluentd Ecosystem but uses much much fewer resources. It creates a tiny little footprint on your system’s memory. In the Kubernetes environment, it is installed as a DaemonSet resource.
InfluxDB will be used as data storage so that it can hold the data forwarded by Fluent Bit. InfluxDB is a popular time-series database designed to handle high write and query loads. Since we will store lots of application logs in real-time, I think Influx is a very good option here.
Grafana will provide supports to create dashboards and panels where we can query over the data from InfluxDB.
Preparing the cluster
We will be using Helm to package and deploy required applications and dependencies into the cluster. Official Helm charts for both Fluent Bit, InfluxDB and Grafana are available on GitHub or Helm Hub.
The default settings and config values provided by Helm charts won’t work out of the box for us. So I made a GitHub repository that contains the official Fluent Bit charts, InfluxDB charts, Grafana charts, and a few config adjustments over those. We will be using this directory to deploy all of our apps. Don’t worry I will explain below which configs were adjusted to have our FIG stack!
😉 Pro tip: Try to use Helm 3 as it doesn’t install tiller in your cluster. But if version 2 of Helm is an absolute necessity, look at the Tillerless Helm plugin. You can read more here about why the tiller should not be installed in a cluster.
Deploy the FIG stack
To keep our deployments separated from other running applications in Kubernetes, let’s create a namespace called ‘monitoring’ or a fancy name of your choice.
kubectl create ns monitoring
Since we will be using our GitHub repo, let’s clone this to the local machine.
git clone https://github.com/aniskhan001/fig-stack
cd fig-stack
1. Deploy & Configure InfluxDB
helm upgrade --install influxdb influxdb -n monitoring
There are not many configurations needed for InfluxDB, but the credentials and DB name. We will need to create a database to store the logs forwarded by Fluent Bit. In the influxdb/values.yml file, we provide the DB name using an env variable:
env:
  - name: INFLUXDB_DB
    value: "fluentbit"
That’s it. We are done with InfluxDB! You can continue to step 2.
Note: we are not creating a username and password for this demo. However, in a production environment, we should always create a username and password to ensure DB security.
To have authentication, in the influxdb/values.yml file set these values:
setDefaultUser.enabled: true
setDefaultUser.user.username: my_user
setDefaultUser.user.password: my_pass
If the value of setDefaultUser.user.password is not given it will generate a random password for us and store it as a Kubernetes secret resource.
Also, the persistence is disabled for this demo so that we don’t create a pvc for this. The data won’t persist if the InfluxDB instance fails at some point.
persistence.enabled: false
Don’t forget to enable persistence in a production environment.
2. Deploy & Configure Fluent Bit
helm upgrade --install fluent-bit fluent-bit -n monitoring
The configuration here for Fluent Bit is mainly to tell it to use InfluxDB as the backend. In fluent-bit/values.yml we define it in the ‘backend’ section
backend:
    type: influx
    influx:
    host: influxdb
    port: 8086
    database: fluentbit
    sequence_tag: _seq
Then we will need to configure the InfluxDB output plugin in Fluent Bit’s configuration. In the fluent-bit/templates/config.yml file:
data:
    fluent-bit-service.conf: |
    ...
    ...

    [OUTPUT]
    Name          influxdb
    Match         *
    Host          {{ .Values.backend.influx.host }}
    Port          {{ .Values.backend.influx.port }}
    Database      {{ .Values.backend.influx.database }}
    Sequence_Tag  {{ .Values.backend.influx.sequence_tag }}
3. Deploy & Configure Grafana
helm upgrade --install grafana grafana -n monitoring
After Grafana is installed, let’s port-forward the instance to the local machine to continue for additional settings.
# get the grafana pod name
export GF_POD_NAME=$(kubectl get pod -n monitoring -l app=grafana -o jsonpath="{.items[0].metadata.name}")

# port forward
kubectl -n monitoring port-forward $GF_POD_NAME 3000
Go to: http://localhost:3000/login
Login with: user = admin & pass = badmin
Cause I have set the values of adminPassword in grafana/values.yml for this quick demo! 😬 This is not recommended. You can set a default password here, or just leave it blank to let Helm create a random password during installation.
Then head over to http://localhost:3000/datasources/new to add InfluxDB as a new data source and confirm these below settings:
URL: http://influxdb:8086/
Access: Server (Default)
Database: fluentbit
Pressing the “Save & Test” button should save the data source.
And thus we are ready to run our queries!
Example query and dashboard
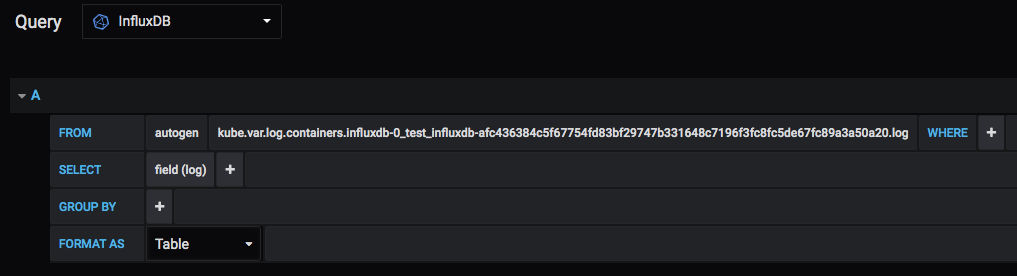
select everything (*) from a measurement in InfluxDB
Using InfluxQL, you can query and grep only the things that are meaningful to your needs. The Influx Query Language is a lot similar to MySQL or other SQL queries.
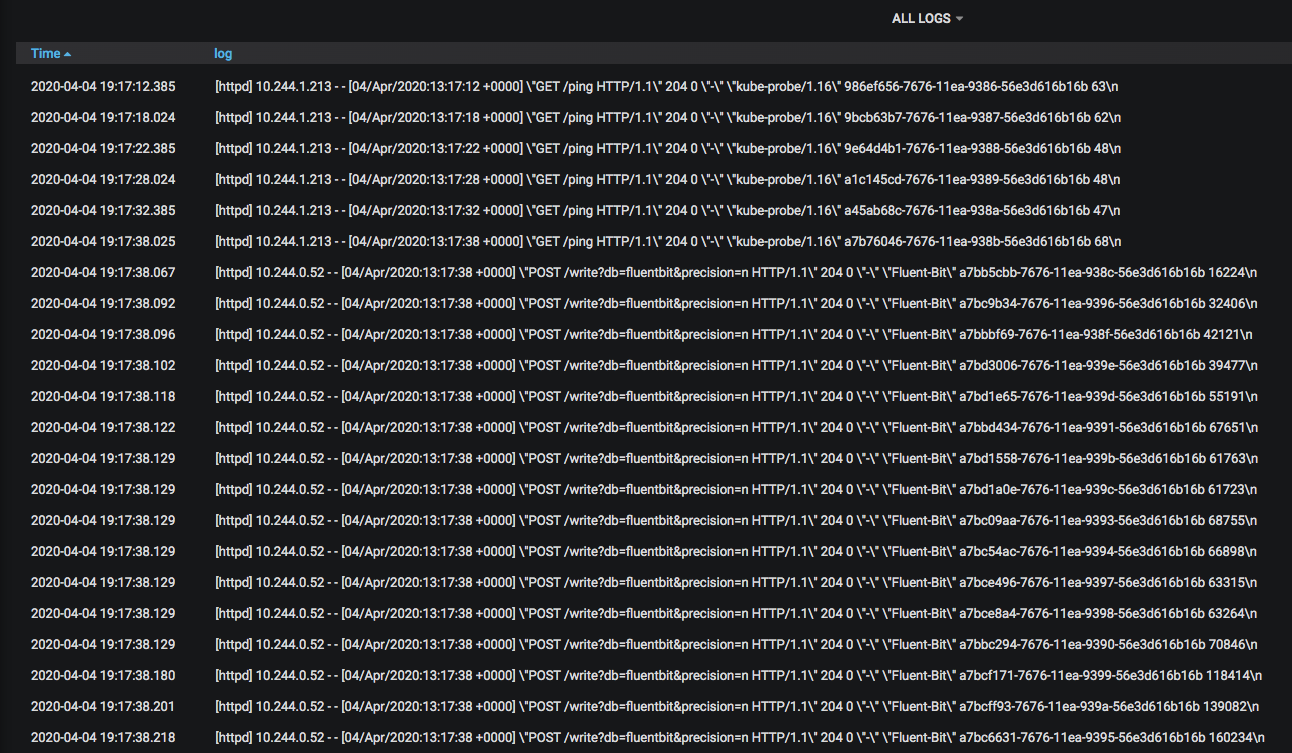
Show all logs from a particular container
That’s a quick setup walkthrough for a lesser-known FIG stack. Initially, I needed a minimal logging setup for viewing application logs and dived into it. While it does serve my purpose; but now, I think this setup can be used to monitor lots of things using the powerful Influx Query Language. For that, the applications should provide meaningful logs to the system.
I hope you enjoyed the walkthrough. Please let me know any questions or suggestions if you have. Also, don’t forget to create issues or send PR to the repo if things need correction and/or enhancement. I’ll be happy to review and add things if necessary.
Resources
The codebase for deployment: https://github.com/aniskhan001/fig-stack
Fluent Bit output plugin config: https://docs.fluentbit.io/manual/v/1.3/output/influxdb
Learn the InfluxDB configuration: https://docs.influxdata.com/influxdb/v1.7/administration/config/
How InfluxSQL works: https://docs.influxdata.com/influxdb/v1.7/query_language/spec/